Note
Go to the end to download the full example code.
1D Histogram
Histogram on a regular one-dimensional grid.
The x-axis defines the bin edges. As illustrated in this example, the bin widths are not necessarily identical.
@NX_class = "NXroot"
@default = "scan1"
scan1:
  @NX_class = "NXentry"
  @default = "data"
  data:
    @NX_class = "NXdata"
    @axes = ["x"]
    @signal = "y"
    x: NX_INT64[8]
    y: NX_FLOAT64[7]
Explanation:
@axeshas one value which corresponds to the signal rank of one.yis the default signal to be plotted versusx.xhas one more value thanysince it contains the bin edges.
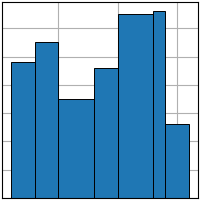
# Data
x = [0.5, 1.5, 2.5, 4, 5, 6.5, 7, 8]
y = [4.8, 5.5, 3.5, 4.6, 6.5, 6.6, 2.6]

# Plot
import numpy as np  # noqa E402
import matplotlib.pyplot as plt  # noqa E402

plt.style.use("_mpl-gallery")

fig, ax = plt.subplots()

centers = 0.5 * (np.array(x[:-1]) + np.array(x[1:]))
widths = np.diff(x)
ax.bar(centers, y, width=widths, edgecolor="k", linewidth=0.7)

plt.show()
Total running time of the script: (0 minutes 0.035 seconds)